
You are leaving 20% in cost savings on the table. Here is why your current freight management system is the problem, and what smart logistics operators across India, the Middle East, and Southeast Asia are doing about it.
The global logistics market hit USD 5.65 trillion in 2025 and is on track to reach USD 23.14 trillion by 2034, growing at a CAGR of 8.36%. That is massive growth. But here is the uncomfortable truth most logistics operators ignore: despite operating in one of the fastest-growing sectors on the planet, the majority of freight operations across emerging markets are bleeding money because of outdated processes that were never designed for the speed, complexity, and scale of modern supply chains.
Whether you run corridors out of Mumbai, manage shipments through Dubai’s trade hubs, coordinate deliveries across Jakarta’s sprawl, or handle last-mile logistics in Johannesburg, the gap between your legacy freight management tools and what machine learning-powered platforms can deliver today is no longer a minor inconvenience. It is a competitive chasm. And every month you delay, that gap widens.
“By evaluating and integrating advanced technologies like agentic AI and intelligent simulation, organizations can achieve specific goals, foster innovation, and achieve long-term competitive advantage.”
— Christian Titze, VP Analyst, Gartner Supply Chain Practice (Source)
Your Current Optimization Is Failing You
Let us be direct. If your freight management still relies on static route planning, manual carrier selection, and spreadsheet-based forecasting, you are losing more than 10% in operational efficiency that could flow straight to your bottom line.
This is not speculation. According to Gartner’s 2025 research, only 29% of supply chains are currently ready for the future. The remaining 71% face an urgent imperative to modernize or risk falling behind in markets growing at 7-10% annually. That is nearly three out of four supply chain operations running on tools and workflows that cannot keep pace with where the industry is headed.
The problem is not that logistics leaders lack ambition. The problem is that traditional freight management software was built for a world that no longer exists. It was built for predictable demand cycles, stable trade routes, and customers who were willing to wait. None of those conditions hold true in 2026.
What Gartner and McKinsey Research Actually Shows
Gartner has identified the defining technology trends reshaping supply chains in 2025, and every single one of them points toward intelligence, connectivity, and autonomy, precisely the capabilities that legacy systems lack.
Agentic AI represents the next frontier. These are systems that autonomously make decisions and execute actions without constant human intervention. In the context of freight management, agentic AI enables dynamic demand forecasting, intelligent supplier selection, and real-time route optimization. Gartner predicts that by 2030, 50% of cross-functional supply chain management solutions will use intelligent agents to autonomously execute decisions.
Ambient Invisible Intelligence leverages ultra-low-cost IoT smart tags and sensors for large-scale tracking, providing real-time visibility into end-to-end supply chains that was simply impossible five years ago.
Augmented Connected Workforce uses digital tools and machine learning to improve decision accuracy and reduce variability, directly addressing the significant skills gap across today’s logistics workforce.
Meanwhile, McKinsey research documents the concrete impact that machine learning and generative AI are delivering right now in logistics operations:
| Operational Area | Documented Improvement |
|---|---|
| Overall logistics costs | 5-20% reduction |
| Inventory levels | 20-30% reduction |
| Procurement spend | 5-15% savings |
| Warehouse capacity utilization | 7-15% additional capacity |
| Forecast errors | 30-40% reduction |
| Planning time | Up to 90% reduction |
These are not theoretical projections. These are measured results from companies that have already made the shift. Every quarter you wait to adopt intelligent optimization, you fall further behind organizations that are compounding these gains.

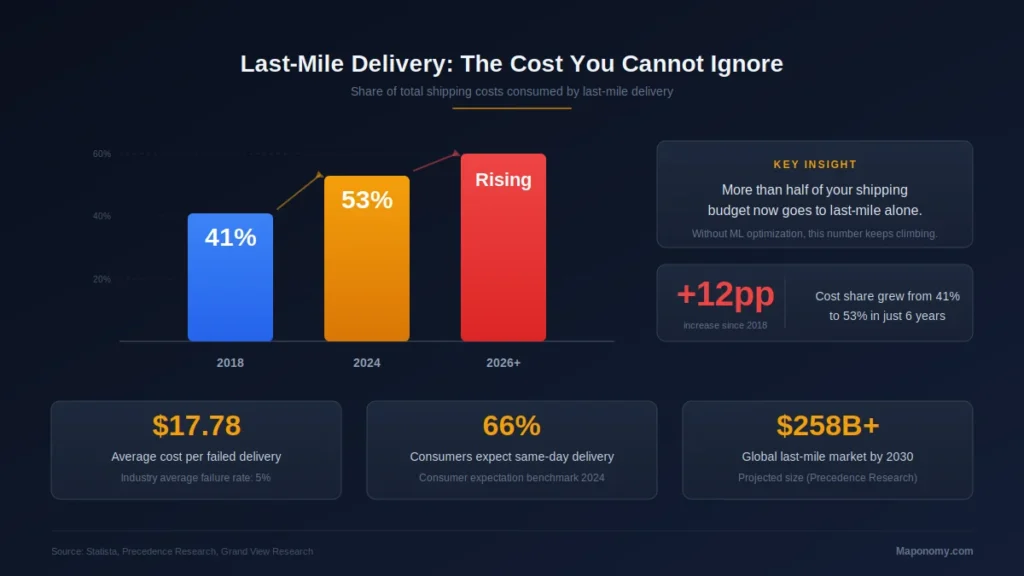
The Last-Mile Crisis: Where Most Companies Hemorrhage Profit
If there is one segment of logistics where the failure of traditional software is most visible and most costly, it is last-mile delivery.
According to Statista, last-mile delivery costs have surged from 41% of total shipping costs in 2018 to 53% in 2024. That means more than half of your entire shipping budget is now consumed by the final leg of delivery alone. And that number is still climbing.
Consider the economics:
- USD 17.78: Average cost per failed delivery
- 5%: Industry average failure rate using traditional dispatch methods
- 66%: Consumers who now expect same-day delivery
- USD 258 billion+: Projected global last-mile delivery market by 2030
The global last-mile delivery market is projected to exceed USD 258 billion by 2030. Businesses that fail to optimize this segment with machine learning-driven route planning and IoT-enabled tracking are not just losing efficiency. They are effectively subsidizing waste while competitors gain ground.
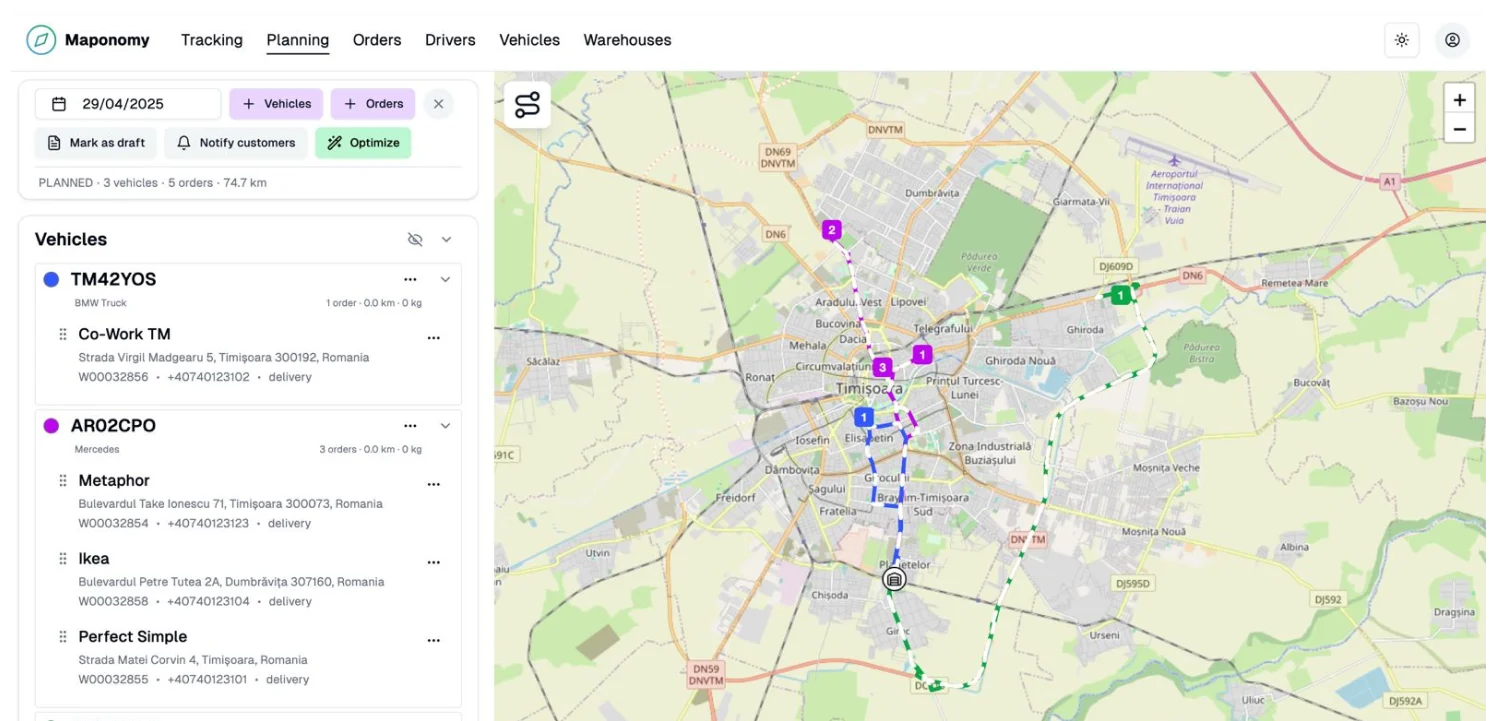
This is where the shift from static routing to dynamic, ML-powered optimization becomes critical. Traditional route planners assign routes once and hope for the best. Intelligent platforms continuously re-optimize based on real-time traffic conditions, delivery time windows, vehicle capacity, driver performance, and even weather patterns. The difference in cost and delivery success rates is dramatic.
How Last-Mile Delivery Has Changed Since Generative AI
The introduction of generative AI and large language models into logistics workflows has fundamentally altered what is possible in last-mile operations. Before 2023, route optimization was largely a constraint-satisfaction problem solved by classical algorithms. Today, machine learning models trained on massive datasets of delivery patterns, traffic flows, and customer behavior can predict and prevent delivery failures before they occur.
FedEx is a clear example of this transformation in action. The company deployed machine learning-powered route optimization and reported delivery time reductions of up to 20% and fuel consumption cuts of 15% across pilot regions. Their “Hold-to-Match” solution uses intelligent algorithms to consolidate shipments heading to the same address, cutting last-mile costs significantly. FedEx Surround, their real-time monitoring platform, integrates IoT sensor data with predictive analytics to track shipments and forecast disruptions before they impact delivery windows.
The results are not limited to FedEx. UPS has refined its ORION route optimization system to process 30,000 route calculations per minute, saving 38 million liters of fuel annually. DHL’s machine learning-powered forecasting platform has reduced delivery times by 25% across 220 countries. These are not experimental pilot programs. These are full-scale production deployments generating billions in cost savings.
Most mid-market logistics companies are still running dispatch workflows that were designed before generative AI and IoT connectivity existed. The gap between what leading operators achieve and what the average company tolerates is widening every quarter.
Regional Market Dynamics: Where the Opportunity Is Largest
India: The Fastest-Growing Logistics Powerhouse
India’s logistics market was valued at USD 228.4 billion in 2024 and is expected to reach USD 357.3 billion by 2030, growing at a CAGR of 7.7%. The country has climbed to 38th position in the World Bank’s Logistics Performance Index, up from 44th in 2018.
But here is the critical number: India’s logistics cost as a percentage of GDP sits at 13-14%, compared to 8% in developed economies. That 5-6 percentage point gap represents both a massive inefficiency and an equally massive opportunity for companies deploying machine learning optimization and IoT-enabled tracking.
The National Logistics Policy and Gati Shakti initiative are channeling billions into infrastructure. But hardware alone will not close that gap. The real transformation is happening through technology: intelligent route optimization, IoT-enabled fleet tracking, and ML-driven demand forecasting are helping forward-thinking logistics providers slash costs across India’s diverse terrain.
Related: How a Food Delivery Company Reduced Delivery Costs by 20% Using Maponomy’s Optimization Platform
Middle East: Trade Crossroads Demanding World-Class Operations
The UAE, Saudi Arabia, and other Gulf states have positioned themselves as global logistics hubs connecting East and West. The UAE is expected to register the highest logistics CAGR from 2025 to 2030 among global markets.
With Saudi Vision 2030 and Dubai’s ambition to become the world’s leading logistics center, the demand for intelligent freight management solutions built on machine learning and IoT is surging. Traditional software cannot serve operations that span desert highways, congested urban corridors, and complex customs environments simultaneously. Only platforms with dynamic re-routing and real-time IoT visibility can deliver the consistency these markets demand.
Southeast Asia: E-Commerce Meets Geographic Complexity
Southeast Asia’s combined logistics market exceeds USD 200 billion, with e-commerce logistics growing at 12.9-26.4% CAGR. Singapore ranks first globally on the World Bank’s Logistics Performance Index, serving as the regional hub. But reaching consumers across Indonesia’s 17,000 islands, the Philippines’ scattered geography, and Vietnam’s diverse terrain demands intelligent systems that adapt to wildly different operational realities, not static route planners built for flat, grid-based urban layouts.
North America and Europe: Mature Markets Under Pressure
Even in North America (35% global freight software market share) and Europe (30%), traditional systems are losing ground. The competitive pressure from companies deploying machine learning optimization is forcing a reckoning. Freight management software market growth in these regions (6.2-6.5% CAGR) lags behind Asia Pacific’s 10.42% precisely because early adopters have already moved past legacy tools, while laggards cling to systems that no longer deliver acceptable returns.
Related: Enhancing Same-Day and On-Demand Deliveries with Maponomy Route Optimization
Freight Management Software Market: Regional Growth (2025-2034)
| Region | CAGR | Market Share |
|---|---|---|
| Asia Pacific (Overall) | 10.42% | 25% |
| South Asia and Pacific | 8.1% | Fastest growing |
| India | 7.9% | Rising rapidly |
| Middle East and Africa | 7.5% | 10% combined |
| North America | 6.5% | 35% |
| Europe | 6.2% | 30% |
Source: Straits Research, Future Market Insights, IMARC Group
What Modern Freight Management Software Must Deliver
When evaluating freight management solutions for operations spanning emerging markets, logistics leaders should demand these non-negotiable capabilities:
End-to-End Supply Chain Visibility with IoT Integration
Your platform must provide real-time tracking across the entire supply chain, from first-mile pickup through mid-mile consolidation to last-mile delivery. This means GPS tracking, IoT sensor data from smart tags, milestone updates, proactive exception management, and the ability to share visibility with customers and partners through live tracking dashboards.
Without comprehensive, IoT-powered visibility, optimization is impossible. You cannot improve what you cannot measure.
Machine Learning-Powered Route Optimization
Static route planning belongs in the past. Modern freight management demands intelligent systems that continuously optimize routes based on real-time conditions, historical delivery patterns, customer requirements, and operational constraints. The system should account for traffic patterns, vehicle capacity, driver skills, delivery time windows, fuel efficiency, and local regulations. Dynamic re-routing capabilities are essential for handling unexpected roadblocks, weather disruptions, or last-minute order changes.
Multi-Carrier Orchestration
Operating across diverse markets requires working with dozens of carriers, 3PLs, and local delivery partners. Your platform must orchestrate operations across these providers from a single dashboard, enabling intelligent allocation based on cost, speed, and reliability metrics powered by machine learning scoring.
Automated Workflows and Intelligent Exception Handling
Manual processes are the enemy of scale and efficiency. Automation should cover freight procurement, carrier selection, shipment booking, tracking updates, settlement, and exception handling. Every manual touchpoint is an opportunity for error, delay, and cost increase.
Related: How Accurate ETAs from Maponomy Improve Customer Satisfaction in Last-Mile Deliveries
The Business Case: Quantified ROI from Intelligent Freight Management
Organizations implementing machine learning-powered freight management solutions consistently report transformational results:
| Metric | Improvement Range |
|---|---|
| Overall freight costs | 12-20% reduction |
| Last-mile delivery costs | 14-15% reduction |
| Customer complaints | 25-30% decrease |
| Vehicle capacity utilization | 30%+ improvement |
| Route planning time | 40-50% reduction |
| Failed deliveries | Reduced from 5% to under 2% |
The reverse logistics segment alone is projected to grow from USD 872.6 billion in 2025 to USD 1.75 trillion by 2035. Companies without intelligent systems to manage returns efficiently will see margins erode as e-commerce return rates continue climbing.
Implementation Roadmap: From Legacy to Intelligent Operations
Adopting modern freight management software requires careful planning, particularly for organizations operating across multiple markets.
Phase 1: Visibility Foundation (Months 1-3)
Deploy comprehensive IoT-enabled tracking and visibility capabilities. This provides immediate value while establishing the data foundation for machine learning optimization.
Phase 2: High-Impact Optimization (Months 3-6)
Apply ML-powered route optimization to your highest-volume, highest-cost routes first. The improvements here will fund expansion to other areas.
Phase 3: System Integration (Months 4-8)
Connect with existing ERP, WMS, TMS, and carrier systems. Prioritize solutions with robust API capabilities for seamless data flow.
Phase 4: Scale and Expand (Months 6-12+)
Roll out to additional markets and routes based on measured results. Continuously train your ML models on operational data to compound efficiency gains.
Related: Maponomy’s Seamless Integration with ERPNext
The Bottom Line
The freight and logistics landscape across India, the Middle East, Southeast Asia, North America, and Europe is transforming at a pace that traditional software simply cannot match. E-commerce growth, consumer expectations for speed and real-time visibility, environmental regulations, and competitive pressure from machine learning-powered operators are converging to create an environment where intelligent optimization is the only path to sustained profitability.
Traditional freight management, characterized by manual processes, fragmented visibility, and reactive decision-making, was not designed for this reality. The gap between leaders deploying ML-powered, IoT-connected platforms and operators clinging to legacy systems will only widen.
As Gartner research confirms, only 29% of supply chains are currently ready for what comes next. The technology exists. The business case is proven by companies like FedEx, UPS, and DHL. The only remaining variable is your decision to act.
Tags: freight management software, last mile delivery optimization, route optimization API, logistics technology 2026, AI in logistics, machine learning supply chain, IoT logistics tracking, e-commerce logistics, smart logistics, India logistics market, Middle East logistics, Southeast Asia shipping, North America freight, generative AI logistics, delivery route optimization, supply chain visibility, Maponomy
Sources: Gartner, McKinsey and Company, Precedence Research, Grand View Research, Statista, World Bank Logistics Performance Index, Straits Research, Future Market Insights, IMARC Group
Image Credits: Infographics created by Maponomy and special credits to pexels.com.