
The delivery truck left the depot at 7:14 AM. By the time it returned at 6:40 PM, it had covered 187 kilometres. The driver completed 23 drops. The operations manager looked at the report that evening and called it a good day. What the report did not show was that a smarter sequence one that accounted for traffic windows, failed-delivery risk by address, and vehicle load distribution – would have completed all 23 drops in 154 kilometres. That is 33 kilometres of pure waste. Multiply that by 80 vehicles, 250 working days, and the current cost of diesel, and you are looking at a number that would make any CFO stop mid-sentence.
This is not an edge case. It is the default operating state for the majority of logistics fleets across North America, the Middle East, and South Asia that are still running conventional route planning tools. These systems were built to assign stops to drivers. They were never built to learn, adapt, or continuously close the gap between what is planned and what is optimal.
The question is not whether you are covering unnecessary miles. You are. The question is how many, and what it is costing you across fuel spend, vehicle wear, driver time, and carbon output – and whether you are willing to do something about it before your competitors do.
Why Mileage Inefficiency Is Hiding in Plain Sight
Most logistics managers track miles traveled as a volume figure – total kilometres driven per day, per vehicle, per month. What they rarely track is the ratio of productive to unproductive kilometres: how much of that distance was genuinely required to complete each delivery, and how much was the result of poor sequencing, empty return legs, redundant territory overlap, or failed first-attempt deliveries that forced a re-run the following day.
Gartner research on supply chain execution technology highlights that visibility and real-time adaptability are the two most consistent gaps between high-performing and average-performing logistics operations. Gartner Supply Chain Research. When you cannot see where inefficiency is occurring in real time, you cannot correct it. And when your planning tool recalculates nothing after the driver leaves the depot, every variable that changes during the day – a traffic jam, a refused delivery, an added urgent order – becomes waste that compounds silently across your entire fleet.
The problem is structural, not operational. It is not that dispatchers are making poor decisions. It is that the tools they are using were not designed for the complexity of modern delivery environments. A static routing tool processing today’s orders in today’s conditions using yesterday’s fixed parameters is not an optimization tool. It is a scheduling tool with an optimization label on it.
What Machine Learning Changes About Route Planning
A machine learning routing engine does not simply find a route. It builds a predictive model of your specific delivery environment — and it keeps improving that model with every trip your fleet completes.
Here is what that means in practice. A standard routing algorithm treats all addresses in a given zone as equally accessible and equally likely to result in a successful first-attempt delivery. A machine learning model knows, based on thousands of previous delivery events, that the residential blocks in a particular neighbourhood have a 34% higher refusal rate on Monday mornings, that one industrial area is effectively unreachable between 11 AM and 2 PM due to loading bay congestion, and that a specific building cluster is best served by a particular vehicle type due to access restrictions. The model factors all of this in before the driver receives their sequence for the day.
The outcome is a route that is not just shorter on paper but shorter in practice — because it is built on an accurate prediction of how that day will actually unfold, not on an idealised map of how it should unfold in theory.
Bloomberg Intelligence reporting on logistics technology adoption found that companies deploying machine learning route optimisation recorded an average reduction of 22% in kilometres driven per delivery within the first two quarters of full deployment. Bloomberg Intelligence Logistics Technology Coverage. That is not a marginal improvement. At scale, it is a fundamental shift in operating economics.
IoT Connectivity: The Real-Time Layer That Makes It Work
Machine learning models are only as good as the data they receive. A model working from last week’s delivery logs is useful. A model receiving live data from every vehicle in the fleet – right now, in motion – is transformative.
IoT-connected fleet management is the infrastructure layer that closes this gap. When every vehicle is transmitting live location, speed, load status, and delivery confirmation data, the optimisation engine is no longer predicting what is happening across your fleet. It knows. And it can respond in real time when something deviates from the plan.
A driver completes a delivery 18 minutes ahead of schedule. The system immediately re-evaluates the remaining sequence and identifies that the next three stops can be reordered to avoid an upcoming traffic buildup the live traffic feed is already detecting. The driver receives an updated sequence on their device before they start the engine. No dispatcher intervention. No phone call. The adjustment happens automatically, within seconds.
This kind of real-time closed-loop optimisation is not theoretical. It is the operational standard that leading logistics operators in North America and the Middle East have been moving toward since 2022, and which platforms like Maponomy are making accessible to mid-sized and regional fleets that previously assumed this capability was only viable at enterprise scale.
In markets like the UAE and Saudi Arabia, where address infrastructure is inconsistent and delivery locations often require driver navigation beyond the pin, IoT-enabled geocoding combined with live driver-customer communication has lifted first-attempt delivery success rates by 12 to 18 percentage points for operators who have deployed the full stack.
The Territory Problem No One Talks About
Route optimisation gets most of the attention in logistics technology discussions. Territory design – the upstream decision about which drivers and vehicles are responsible for which zones – gets almost none. This is a significant oversight, because poor territory design forces inefficiency into routes before the optimisation engine even begins its work.
When territories are drawn based on geography alone – postal codes, city boundaries, or hand-drawn zone maps – they almost always produce imbalances. One territory has 40% more stops than another on peak days. Two drivers regularly overlap in the same block because their zones share a boundary. A single large industrial estate sits at the edge of three territories, so it is served by three different vehicles on the same morning when one would suffice.
Machine learning territory optimisation solves this by treating zone design as a dynamic rather than static problem. Territories are shaped by demand density, historical delivery volume patterns, driver capacity, vehicle type distribution, and time-of-day access constraints – not just geographic boundaries. They are also recalibrated regularly as demand patterns shift, which is particularly important for e-commerce and retail distribution operations where volume concentration changes week to week.
The impact on miles traveled is direct. Better territory design means fewer cross-zone journeys, higher delivery density per route, and consistently lower kilometres per drop across the fleet.
Dynamic Order Batching and the Quick Commerce Challenge
The rise of sub-two-hour delivery windows – driven by quick commerce platforms in markets including the Middle East, North America, and South and Southeast Asia – has created a specific operational challenge that conventional planning tools handle poorly.
When orders arrive continuously throughout the day and must be dispatched within narrow time windows, the batching decisions made at the point of dispatch have an outsized impact on total distance traveled. Two orders heading to addresses 400 metres apart, dispatched in separate trips because they arrived 12 minutes apart, represent a straightforward and avoidable efficiency loss. Across hundreds of orders per day, these micro-inefficiencies accumulate into significant excess mileage.
Machine learning order batching engines evaluate incoming orders against current fleet positions, active route sequences, and proximity clusters in real time. They identify which orders can be grouped for a single trip without compromising the delivery window for either, and they trigger dispatch at the optimal moment – not the earliest possible moment, which is the default behaviour of conventional systems.
FedEx has been particularly transparent about its adoption of this approach within its express and same-day delivery network in the United States. Beginning in 2023, the company integrated machine learning dispatch and batching tools into its last-mile operations for high-density urban zones. The result has been measurable reduction in vehicle dispatches per order volume and a corresponding drop in per-package delivery cost. The reason it works is that the system is making batching decisions on a continuous basis, across thousands of concurrent orders, in a way that no human dispatcher and no static planning rule can replicate.
The Sustainability Case: Fewer Miles Is a Business Decision, Not Just a Values Statement
There is a version of this conversation that frames sustainability as separate from commercial performance – a box to tick for ESG reporting, a marketing message for environmentally conscious customers. That framing undervalues the business case considerably.
Every kilometre removed from a delivery route reduces fuel spend directly. It reduces vehicle maintenance costs, which accumulate in proportion to distance driven. It reduces driver hours, which carry both direct payroll cost and regulatory limits. And it reduces the probability of end-of-day vehicle issues that cause the following morning’s operations to start late.
Transportation accounts for a significant portion of supply chain carbon emissions globally – estimates consistently place road freight at over a third of logistics-related CO2 output. For businesses operating in jurisdictions with carbon pricing, emissions reporting obligations, or supply chain sustainability requirements embedded in customer contracts – increasingly common for enterprise suppliers in North America and Europe – this is a cost centre with a regulatory dimension, not just an environmental one.
Intelligent vehicle selection adds another lever. When the routing engine knows which portions of a route fall within the operational range of electric vehicles in the fleet, it can automatically assign those segments to EVs – reducing fuel cost and emissions simultaneously, without requiring a dispatcher to evaluate each trip manually.
Maponomy’s platform includes fleet composition analysis as a core feature – not an add-on – precisely because the miles-traveled problem and the sustainability problem are the same problem viewed from two different angles.
What the Numbers Look Like at Operational Scale
To make this concrete, consider a regional logistics operator running a fleet of 60 vehicles across a mid-sized metropolitan market – a profile that fits dozens of operators in the Gulf region, as well as regional carriers and 3PL operators in markets like the US Midwest or Canada’s major urban corridors.
At 60 vehicles, each averaging 160 kilometres per day across 250 working days, the annual fleet distance is 2.4 million kilometres. At a blended fuel and operating cost of $0.28 per kilometre – conservative for most markets -that is $672,000 in annual operating spend attributable to distance driven.
A reduction of 15% in kilometres driven through machine learning route optimisation and dynamic territory management reduces that figure by over $100,000 per year. Add the impact of improved first-attempt delivery rates – fewer re-attempts mean fewer additional trips – and the downstream savings on vehicle maintenance cycles, and the total annual benefit to an operator of this size typically lands between $140,000 and $220,000.
That is the range that Maponomy clients in the Middle East and North America have reported in the 12 to 18 months following full platform deployment. It is not a projection. It is an outcome.
Key Statistics at a Glance
The following figures are drawn from publicly available industry research and from reported outcomes across logistics technology deployments:
- Last-mile delivery accounts for 53% of total end-to-end shipping cost (Capgemini Research Institute, 2023)
- Road transport accounts for approximately 37% of global logistics CO2 emissions (International Transport Forum, 2023)
- Machine learning route optimisation deployments have delivered an average 18-23% reduction in kilometres per delivery (Fleet Rabbit 2025)
- First-attempt delivery failure adds an average of $17 in reverse logistics and re-delivery cost per package (shipveho, 2025)
- Vehicle capacity utilisation improves by an average of 25-31% following territory and route optimisation implementation(McKinsey)
- Operators using dynamic order batching report 12-17% more deliveries completed per driver per day versus static planning (McKinsey)
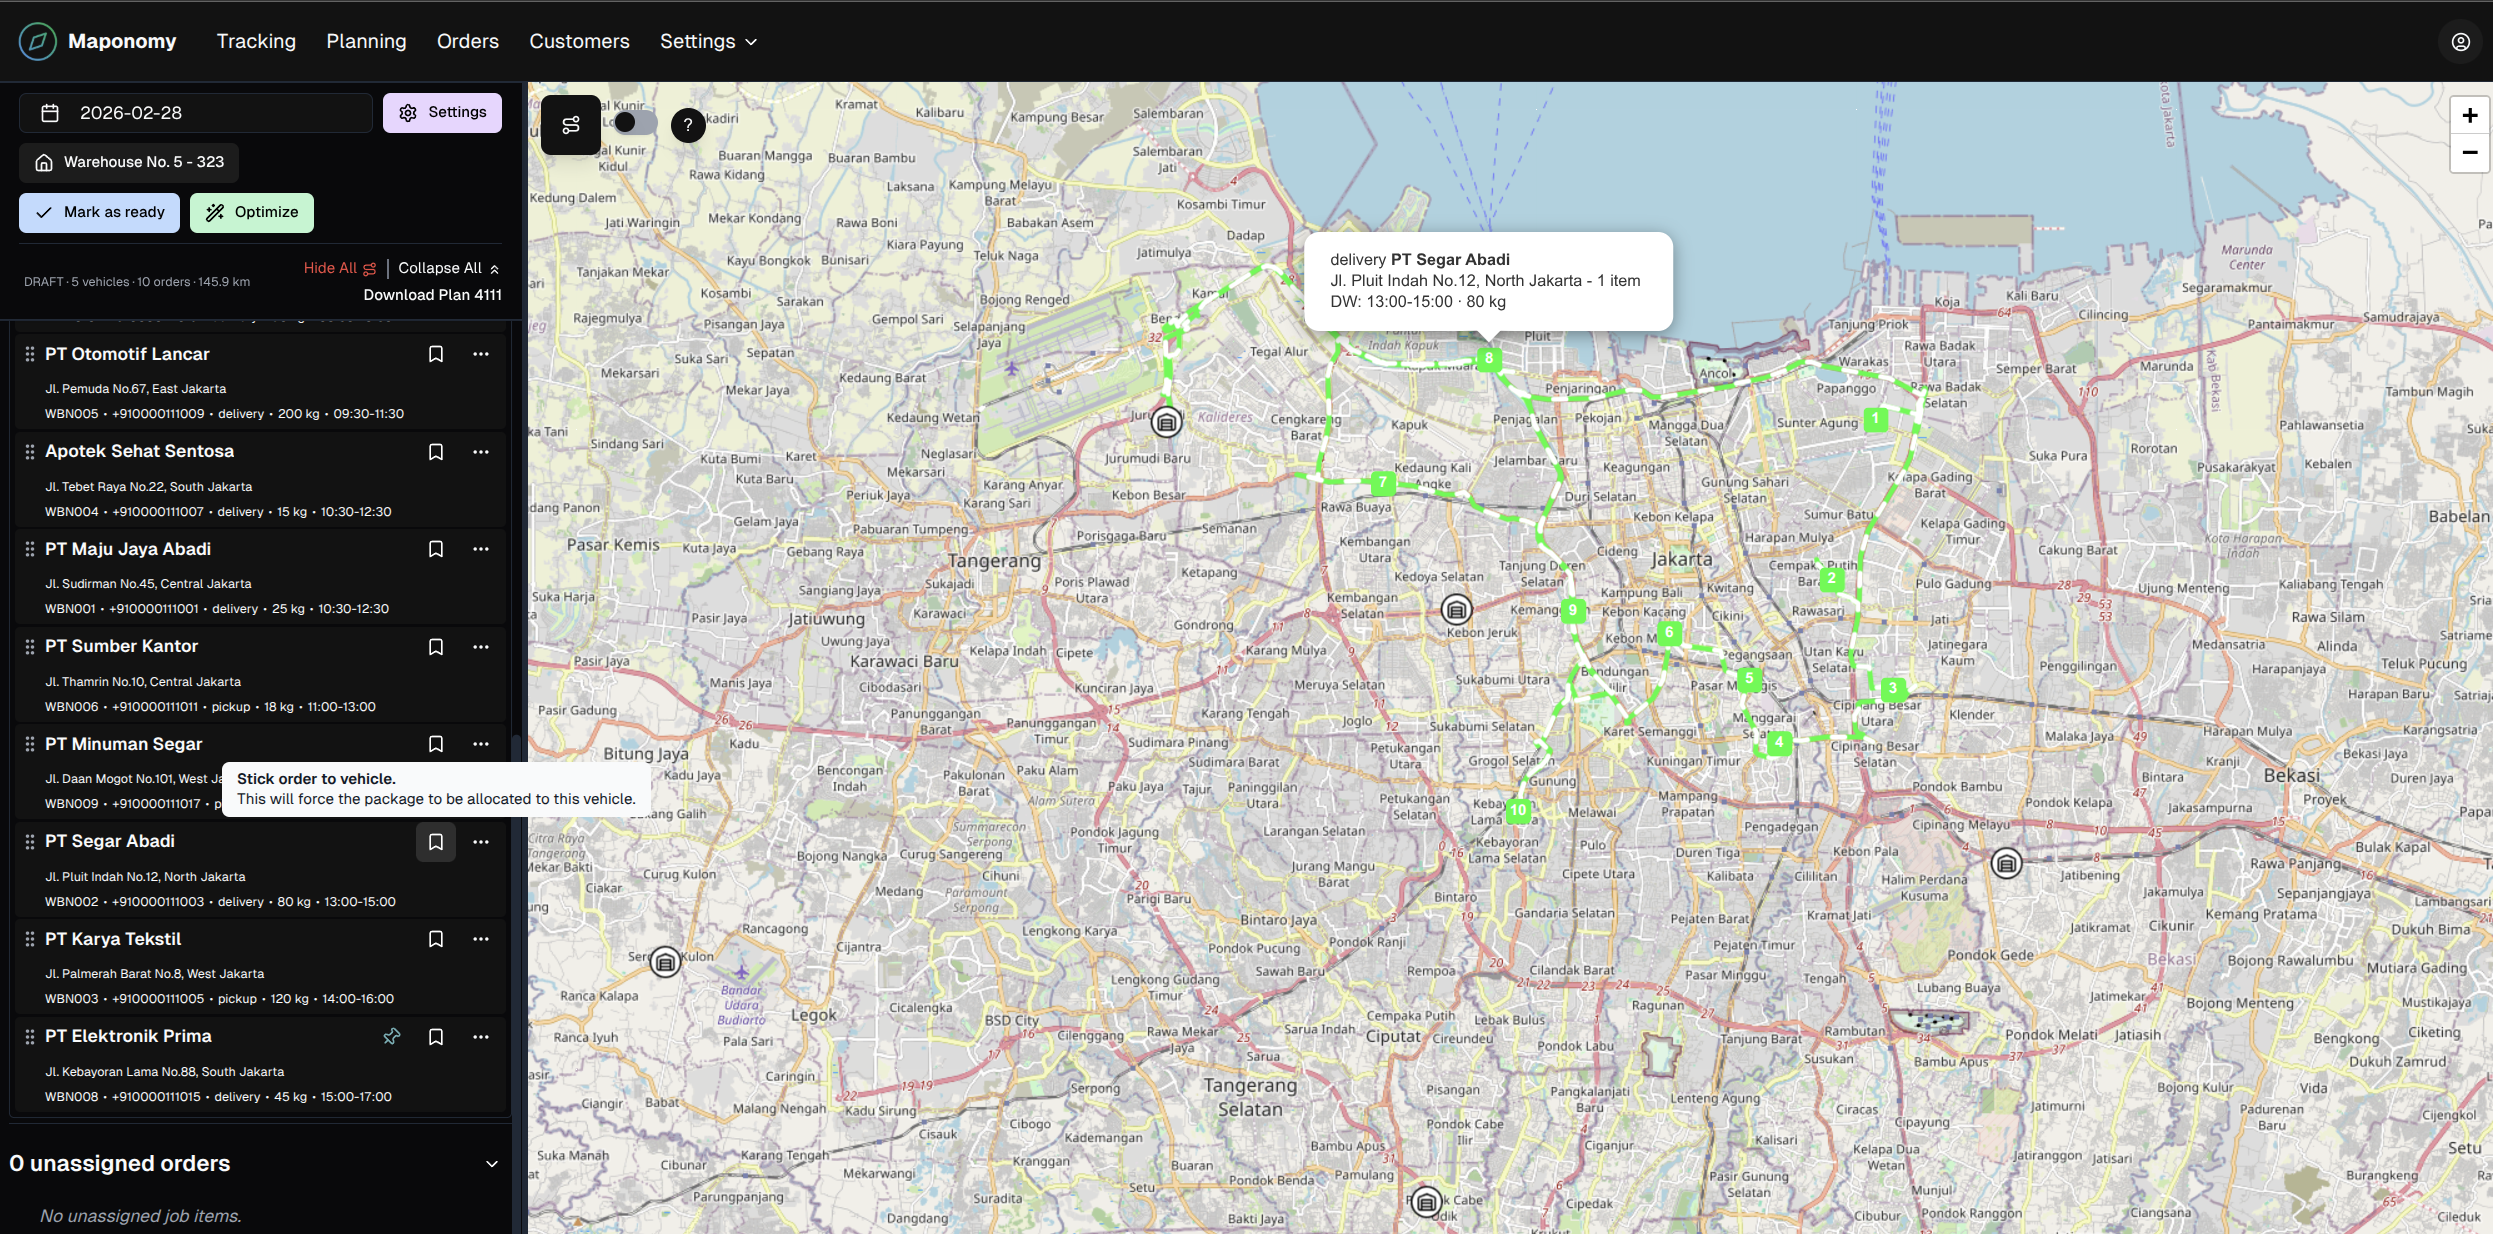
Maponomy Plan Optimisation Dashboard – Every vehicle, every route, every delivery all visible and adjustable in real time.
How Maponomy Approaches The Problem
Maponomy was built around a single operational insight: the distance your fleet travels is the most controllable major cost variable in last-mile logistics, and the tools most operators are using to control it are not adequate for the job.
The platform combines machine learning route planning, real-time IoT fleet data, dynamic territory management, and intelligent order batching into a single operating environment. Each component feeds the others — delivery outcome data improves the routing model, live vehicle data enables real-time resequencing, territory analysis informs demand-driven zone design, and batching logic responds to the current state of the fleet rather than a static dispatch schedule.
For operators in the Middle East managing deliveries across ambiguous addressing environments, Maponomy’s geocoding layer and driver-customer communication tools specifically address the first-attempt delivery success problem — reducing the re-attempt trips that are among the most expensive and least visible contributors to excess mileage.
For e-commerce and retail logistics operators in North America managing high-volume, time-sensitive delivery programmes, the platform’s capacity to handle continuous order ingestion and real-time batching decisions enables same-day delivery economics that static planning cannot sustain.
The platform is designed to be operational within weeks, not months, and is built to improve measurably over the first 90 days as the machine learning models train on your specific delivery data.
Tags: last-mile delivery, route optimisation, smart logistics, fleet management, supply chain sustainability, machine learning logistics, IoT fleet, e-commerce delivery, Middle East logistics, North America supply chain, miles traveled, green logistics, delivery cost reduction, dynamic routing, territory optimisation